How does checking your investment regularly impact your investment goals?
Whether we like it or not, we are emotionally attached to our finances, especially our investments. I understand this because I also fall into this trap, even though I’m a financial professional. March was not a fun month for me or just about any investor in the world. We saw significant downward movements in markets across the globe, and there was nowhere to hide except cash. It also didn’t help that I checked regularly on my portfolio’s performance. I was shocked, even though I knew it was bad, but I found solace in the fact that markets will recover again, and this was short-term. The funny thing was that my portfolio was still up year-to-date, and I was still up, but I anchored the investment value and saw the past month’s investment performance as a loss, but I was still in the money.
I fell into two traps. I anchored a number, and I had given in to myopic loss aversion.
What Myopic loss aversion? Simply put, Investors feel losses more strongly than gains (loss aversion). This led me to experience anxiety and consider making a change to my portfolio’s. (Luckily I didn’t).
This led my into doing some more research into markets and how they behave on a daily, monthly, quarterly, and yearly basis. I was quite shocked by the data and how I could potentially sabotage my portfolio.
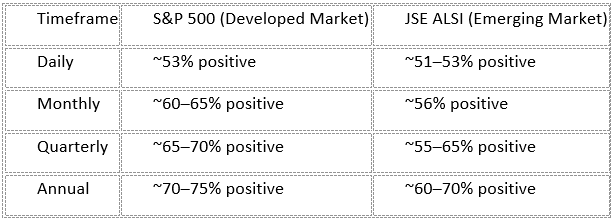
When looking at the S&P 500 and the JSE, you can see data that is very closely correlated with each other. When looking at the daily performance of the indices over the past 15 years, you would see that the S&P 500 had positive 53% of trading days and negative 47%. When looking at the JSE on a daily basis, you would see 51% to 53% positive days and 47% to 49% negative days.
Even in strong bull markets, almost half of all days are negative. Returns are driven by a relatively small number of strong up days.
When looking at monthly performance, the S&P had 60%–65% positive months vs 35%-40% negative months. The JSE had 56% positive months vs 44% negative months. You can already start to see how the data is moving in a more positive direction.
When looking at quarterly performance, the picture becomes even better. The S&P delivered Positive quarters between 65%–70% and negative quarters between 30%-35%. When looking at the JSE, it delivered positive quarters between 55%–65% and negative quarters between 35%-40%.
When looking at the yearly performance, the S&P delivered 75%-80% positive months vs 25%-30% negative returns. The JSE delivered 60%-70% positive years vs 40%-30% negative years.
Losses at the yearly level are relatively infrequent but can be sharp.
The pattern becomes very clear:
The longer the timeframe, the higher the probability of a positive return. Short-term volatility is normal and persistent. Long-term returns are driven by compounding and upward drift.
Practical interpretation (important)
Volatility is constant. Even in strong years, many days and months are negative. This is why timing the market is extremely difficult.
Time horizon is everything
- Daily investing feels like a coin flip.
- Long-term investing becomes probability in your favour.
Best days matter disproportionately
Missing a handful of strong positive days can materially reduce returns.
Side-by-side summary
What does the data show?
Daily checking increases perceived losses dramatically
A well-known finding:
If you check your portfolio:
Daily → you’ll see losses ~40–45% of the time
Annually → losses drop to ~20–25% of the time
Same investment, completely different emotional experience.
Frequent checkers are more likely to make bad decisions
Research and industry data show:
Investors who monitor portfolios frequently:
- Trade more
- React to short-term volatility
Are more likely to:
- Sell during downturns
- Miss recoveries
How do these behaviours negatively impact your investment performance?
Studies (by Morningstar) estimate that the average investor underperforms their own investments by 1% to 2% due to poor timing decisions and emotional reactions.
Less frequent monitoring improves outcomes.
Investors who check less often tend to stay invested longer, experience less stress, make fewer emotional decisions and this leads to better compounding and more consistent long-term results.
Markets behave like this:
Short-term → noisy, unpredictable
Long-term → upward trending
But, If you check daily, your brain interprets investing as “Constant losses and risk” vs yearly checking your brain will experience “Mostly positive progress”.
For long-term investors:
Ideal review frequency: Quarterly or semi-annually
Avoid: Daily or weekly checking
Focus on: Long-term goals, Asset allocation, not short-term performance
Bottom line
Frequent monitoring does not improve returns. It increases stress and poor decision-making
The best investors are often those who:
- Check less
- React less
- Stay invested
In simple terms:
The more often you look, the more risk you feel — even if the actual long-term risk hasn’t changed.